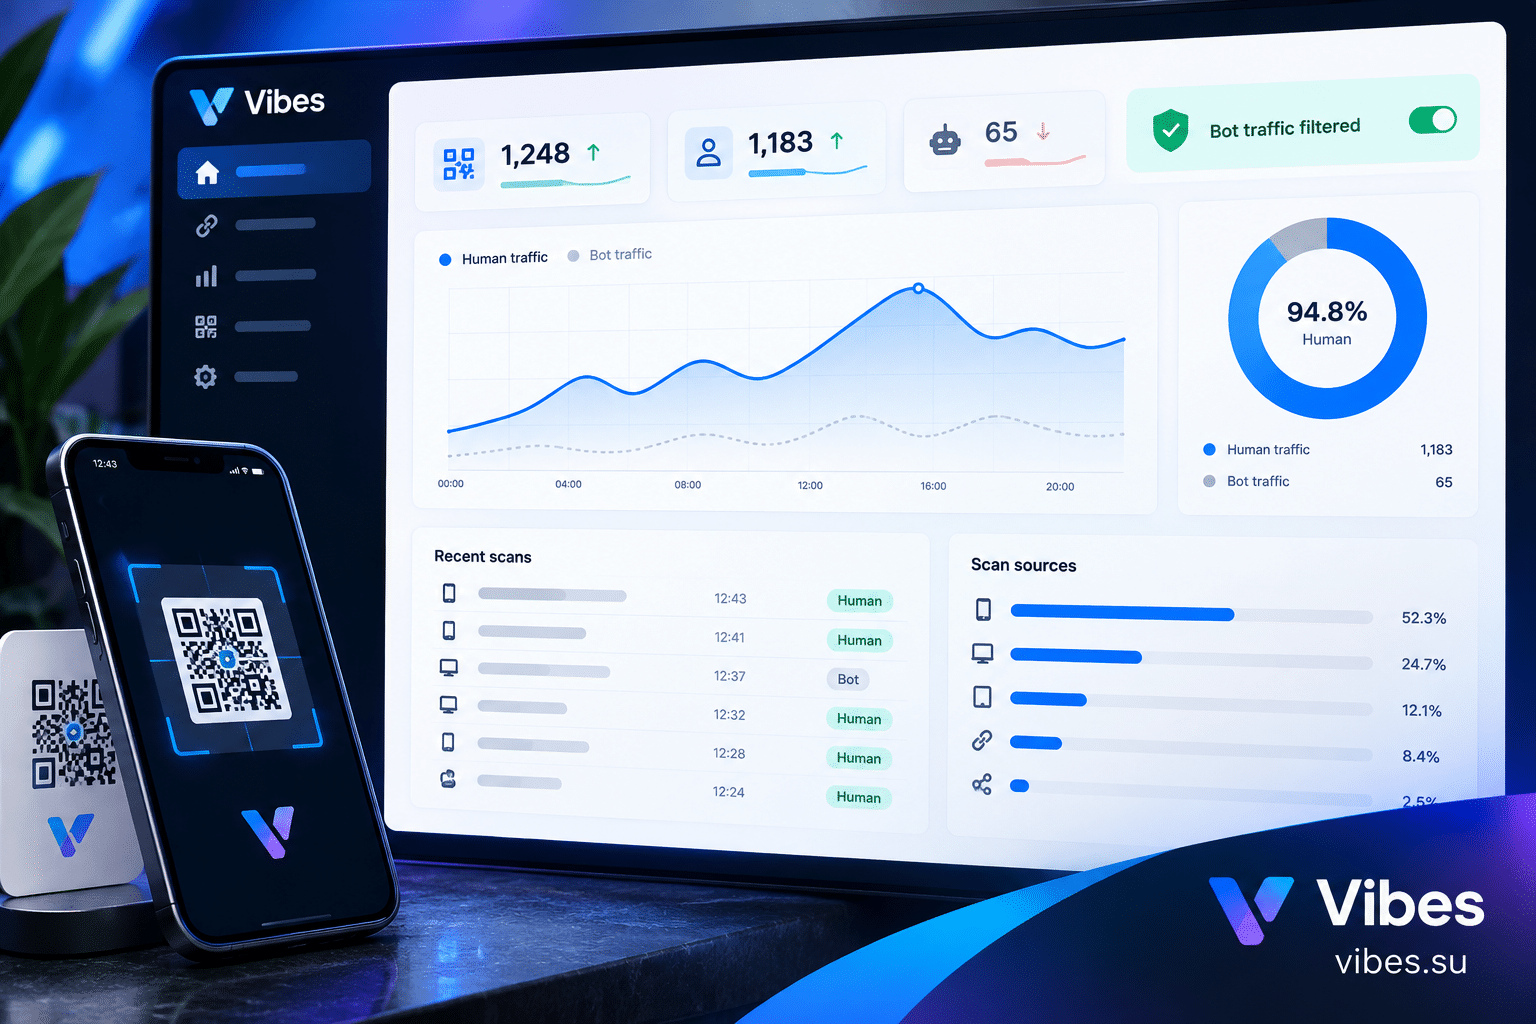
Why QR scan data is not always what it looks like
You launch a QR campaign, check the analytics a few days later, and the numbers look great. Hundreds of scans, strong engagement, everything is working. Then you notice something odd: the scans are coming from countries you do not operate in, at hours when your audience is asleep, from devices that do not match your typical visitor. What looked like success starts to look like noise.
Bot traffic is one of the most common reasons QR analytics become unreliable. It does not mean your campaign failed. It means part of the data you are looking at is not real human behavior, and if you do not separate it, you will make decisions based on numbers that do not reflect reality.
This article explains how to identify bot scans in your QR analytics, what patterns to look for, and how to keep your reporting clean enough to trust.
What counts as bot traffic in QR analytics
Bot traffic in QR analytics is any scan event that was not triggered by a real person deliberately pointing a phone at a code. This can happen for several reasons.
Automated crawlers can follow links, including shortened and QR-linked URLs, if they are exposed somewhere on the web. Security scanners may test links for malware. Preview generators may open links to create thumbnails. Some services prefetch URLs before a user actually clicks. In all of these cases, a scan event is recorded, but no human ever looked at the page.
There is also the possibility of deliberate manipulation: someone trying to inflate numbers, test a system, or interfere with a campaign. This is less common, but it exists.
The challenge is that from the analytics side, all of these events can look similar. A scan is a scan. The difference is in the context around it.
Signs that some of your QR scans are not real
Bot scans rarely announce themselves. But they leave patterns. If you know what to look for, they stand out.
The first sign is a sudden spike that does not match any real-world event. If you did not print new materials, did not launch a campaign, did not post anything new, and yet scans jump, that is worth investigating.
The second sign is scans coming from locations that do not match your audience. If your QR codes are on menus in one city and scans are appearing from three other countries, something is off.
The third sign is scans happening at unusual times. If your business is closed and your audience is asleep, but scans keep coming at a steady rate, those are not likely to be real people.
The fourth sign is identical behavior across many scans. Same device, same browser, same time interval, same path through the site. Real users are messy. Bots are consistent.
The fifth sign is a very short time on page. A bot opens a link, records a visit, and leaves immediately. If many scans show near-zero engagement, that is a strong indicator.
The sixth sign is scans that never convert. If your QR code leads to a form, a purchase, or a signup, and thousands of scans produce zero conversions while other channels convert normally, something is wrong with the scan data.
How to separate real scans from bots in practice
There is no single switch that removes all bot traffic. But there are several practical steps that together make your data much more reliable.
Start by looking at device and browser data. Real QR scans come predominantly from mobile devices. If a large share of scans comes from desktop browsers, or from browsers that do not exist on phones, those are almost certainly not real scans.
Next, look at geography. Compare the countries and cities in your scan data with where your QR codes are actually placed. If the code is on a physical menu in one region, scans from far away need an explanation.
Then look at timing. Real scans follow patterns: mealtimes, business hours, commute times, weekends. Bot scans often do not. If the distribution is flat across the day, that is a signal.
Then look at engagement. Real scans usually lead to some interaction: scrolling, clicking, spending a few seconds on the page. If scans consistently show zero engagement, they are likely automated.
Finally, look at conversion. If your QR code is meant to drive a specific action, compare scan volume with conversion volume. A large gap that cannot be explained by normal drop-off is a sign that many scans were not real.
Why filtering bots matters more than it seems
It is tempting to ignore bot traffic if the overall numbers look good. But unfiltered data causes real problems.
First, it distorts your understanding of what works. If a campaign looks successful because of inflated scans, you may repeat it and be disappointed when real results do not match.
Second, it hides real problems. If bot traffic is masking a drop in genuine scans, you may not notice that your QR code stopped working or that your audience lost interest.
Third, it affects comparisons. If you compare two campaigns and one has more bot traffic than the other, the comparison is meaningless.
Fourth, it affects decisions about budget and effort. If you invest more in a channel because the numbers look good, but those numbers are inflated, you are investing in the wrong place.
Clean data is not a luxury. It is the basis for every decision you make about your QR campaigns.
What to do when you find bot traffic
Finding bot traffic is not a failure. It is useful information. What matters is what you do next.
If the bot traffic comes from a specific source, you can often filter it out in your analytics by excluding certain referrers, user agents, or IP ranges.
If the traffic appears to be random noise, you can focus your reporting on segments that are more likely to be real: mobile devices, expected geographies, expected time windows.
If the traffic seems deliberate, you may need to look at how your QR code is exposed. If the link behind the QR code is also published somewhere on the web, bots can find it. Keeping the link only inside the QR code reduces this risk.
If the traffic is coming through a third-party service that prefetches links, you may be able to adjust settings or choose a different service.
In all cases, the goal is not to eliminate every non-human event. The goal is to make sure your reporting reflects reality closely enough to be useful.
How to set up QR analytics that are easier to trust
Prevention is better than cleanup. A few choices at setup make a big difference later.
Use a service that provides detailed analytics: device, browser, geography, time, and engagement. The more context you have, the easier it is to spot anomalies.
Keep your QR links private. If the URL behind the QR code is only accessible by scanning, bots have fewer ways to find it.
Use dynamic QR codes. They let you change the destination without reprinting, and they often come with better tracking.
Define what a real scan looks like for your use case. For a restaurant menu, it is a mobile device in the local area during opening hours. For a conference badge, it is a device at the venue during the event. Knowing this makes it easier to filter.
Review your data regularly. Anomalies are easier to catch when you look often and know what normal looks like.
For a broader view of how QR analytics fit into your overall measurement, see QR code for events registration and check-in.
Common mistakes when interpreting QR scan data
Even with good intentions, it is easy to misread QR analytics. Here are the mistakes that come up most often.
Mistake one: treating all scans as equal. A scan from a real person in your target area is not the same as a scan from a crawler in another country. If you do not separate them, your averages are misleading.
Mistake two: assuming a drop in scans means the code stopped working. It might mean your audience changed, your placement changed, or bot traffic that used to inflate the numbers stopped.
Mistake three: ignoring engagement. A scan that lasts half a second is not the same as a scan that leads to a two-minute visit. If you only look at scan counts, you miss the quality dimension.
Mistake four: comparing campaigns without normalizing. If one campaign ran in a period with more bot activity, its numbers are not directly comparable to another.
Mistake five: not documenting what you changed. If you adjust filters or exclusions, write down what you did and when. Otherwise, future comparisons become confusing.
How to explain bot traffic to stakeholders
If you report QR performance to a team, a client, or a manager, bot traffic can be awkward to explain. It helps to frame it clearly.
Bot traffic is normal. Any public-facing link attracts some automated activity. It is not a sign that the campaign failed.
The important thing is that you know it is there and that you account for it. Reporting both raw and filtered numbers, with a short explanation of the difference, builds trust.
If the filtered numbers still show good performance, the campaign is working. If they do not, you now have accurate information to decide what to change.
What you want to avoid is presenting inflated numbers that later turn out to be wrong. That damages trust far more than acknowledging bot traffic upfront.
How often to review QR analytics for bot activity
There is no universal schedule, but a practical approach is to review at three levels.
Daily, during an active campaign. Look for sudden spikes or drops that do not match real-world activity.
Weekly, for ongoing QR placements. Look at patterns: geography, devices, timing, engagement.
Monthly, for long-running codes. Look at trends over time and check whether any assumptions you made earlier still hold.
The goal is not to obsess over every number. It is to notice when something changes and to understand why.
When to consider a different QR analytics setup
Sometimes the problem is not the data but the tool. If your current setup does not give you enough detail to separate real scans from bots, it may be worth reviewing.
Signs it might be time to change:
— you cannot see device type, geography, or timing for scans;
— you cannot filter or segment your data;
— you cannot tell whether a scan led to any engagement;
— you cannot export data for further analysis;
— you cannot compare periods or campaigns reliably.
A service that provides richer analytics does not automatically solve the bot problem, but it gives you the tools to address it.
If you are also running A/B tests on your links or destinations, clean scan data becomes even more important. See URL rotation and A/B testing for short links for how to keep those comparisons fair.
Frequently asked questions
Can bot traffic completely ruin QR analytics?
It can distort them significantly if left unfiltered, but it rarely makes the data useless. Once you identify the patterns, you can separate real scans from automated ones and base decisions on the cleaner subset.
How do I know if a scan is from a bot or a real person?
Look at the context: device type, geography, time of day, engagement, and whether the scan led to any meaningful action. Bots tend to be consistent and show little engagement; real users are more varied.
Does using a dynamic QR code reduce bot traffic?
Not directly. But dynamic QR codes often come with better analytics, which makes it easier to spot and filter bot activity. They also let you change the destination without reprinting, which is useful for other reasons.
Should I report raw scan numbers or filtered ones?
Ideally both, with a clear explanation. Raw numbers show total activity; filtered numbers show what is likely to be real human behavior. Reporting only one or the other can mislead.
How much bot traffic is normal?
It varies. Some campaigns see almost none; others see a noticeable share. What matters is not the exact percentage but whether you know it is there and whether you account for it.
Can I block bot traffic entirely?
Not entirely, but you can reduce it. Keeping your QR links private, using services that offer filtering, and excluding known bot sources in your analytics all help. The goal is to make the remaining data reliable, not to achieve zero bot events.